The event took place in Nicosia, Cyprus, Europe, and had at around 400 attendees. Two tracks were featured: one for Developers, and another one for IT-Pros.
I had the pleasure to participate as one of the Cyprus .NET User Group (CDNUG) speakers.
The topic of my session was “Self-Service Business Intelligence with SQL Server 2008 R2”. Actually, I talked about PowerPivot :)
Though before the deep dive into PowerPivot and the demonstration of the unlimited power it offers, I provided a short introduction to the great SQL Server 2008 R2 features along with a first demo showcasing these features.
Some of the exciting new features in SQL Server 2008 R2 (November 2009 CTP) are:
- Connectivity to SQL Azure
- Data-tier Application Upgrade
- SQL Server Utility
- Master Data Services
- StreamInsight
- A large number of enhancements on Reporting Services
After the above introduction to SQL Server 2008 R2, my session got focused on the Analysis Services set of features in SQL Server 2008 R2 and more specifically on SQL Server PowerPivot for Excel 2010.
So what exactly PowerPivot is?
PowerPivot (formerly known as “Gemini”) is an add-on for Excel 2010 / SharePoint 2010 which brings the full power of SQL Server Analysis Services right into Excel.
Its engine called “Vertipaq” uses in-memory column based compression allowing millions of rows of data to be stored, sorted and aggregated.
PowerPivot supports a wide variety of sources and provides the Business User with a rich set of mathematical functionally featuring the existing functions already in Excel and the powerful Data Analysis eXpressions (DAX).
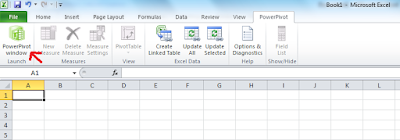
You can access PowerPivot by clicking on the “PowerPivot” button on the Ribbon in Excel 2010:
Within the PowerPivot dialog, under the “Home” menu, you can select from a huge variety of data sources such as:
- Several providers to DBMSs
- Text files
- Excel workbooks
- Reporting services
- RSS feeds
You can even import data from the clipboard with copy-paste!
Under the “Table” menu, you are able to manage tables’ properties along with managing the various relationships between the tables. You can also create new relationships:
Under the “Column” menu, you are able to manage the columns’ properties such as data types and format. Also, you can add new columns:
After importing the data, by returning under the “Home” menu and by clicking on the “PivotTable” button, you are able to create Pivot Tables based on several presets. Then PowerPivot automatically switches back to the workbook (it lets you either create new sheets or use the existing ones) where you are able to easily perform aggregations and many other mathematical calculations on the data you have previously imported.
This is a very basic introduction to PowerPivot as it is within the context of the review regarding my session on Microsoft Momentum 2009. In subsequent posts, I will thoroughly explain and demonstrate all the exciting features of PowerPivot!
Throughout my session many demos were performed including the following scenarios:
- Import data from the clipboard with copy-paste
- Import data from Excel workbooks
- Import data from a SQL Server database containing 5+ million rows
- Perform a mashing-up of data using various data sources (clipboard, excel workbooks, SQL Server database)
Here are some pictures taken during my session:
PowerPoint Presentation
Please find below the PowerPoint presentation of my session at Momentum 2009:
CDNUG Presence
CDNUG presence on the event was strong! We had a special “CDNUG Area” where developers could sign-up with the User Group. Many people expressed interest on the activities of our User Group. The feeling was great! :)
Remarks
The event was definitely a huge success thanks to the great organization of Microsoft and the rich and high-quality content delivered by all the speakers. CDNUG participated by delivering three sessions on the Developers track. You can find the full review of our User Group’s participation on the CDNUG website along with a description of the entire Developers track.
The “PowerPivot Experiment”
I have to admit that I was really looking forward to test the capabilities of SQL Server PowerPivot. Thus being a SQL Server fan, in one of my tweets, I mentioned that I would not rest until I tried the real capabilities of PowerPivot :)
To this end, after the event, I tried importing 100+ Million rows from a SQL Server Database into Excel 2010 using PowerPivot. Guess what? I did it! :)
After designing a database and populating it with a total of 100+ Million rows, I imported the data from its five tables into excel. It only took 7 minutes to import the data! Also, performing aggregations on the data was very fast!
On one of my subsequent posts on PowerPivot, I will provide the schema of my database and a full description of entire process!
Make sure you check back my blog soon for newer posts on this topic!


